A Time to Be Grateful
“Gratitude is not only the greatest of virtues, but the parent of all others.”
—Marcus Tullius Cicero
“If something cannot go on forever, it will stop.”
—Herbert Stein
As we say goodbye to the year 2021, perhaps the best that can be said about it is that it wasn’t as bad as 2020. Faint praise, true, but at least we may be trending in the right direction. It’s easy to feel pessimistic in the context of present-day circumstances, but despite the persistence of the pandemic and the depth of our political divide, we have a duty to resist the laziness of despair, and heed the words of Cicero and other philosophers and consciously cultivate an attitude of gratitude, for we still have much to be grateful about.
Our democracy is wounded, yes, but it is still intact. A vaccine was created in record time. Doctors, nurses, scientists, supply chain workers all stepped up and at great cost to themselves kept us safe, fed, and secure. Unemployment is low; in fact, there is a labor shortage. And then there are the markets. How can we not be grateful for their performance? Putting aside the terrifying and seemingly apocalyptic month of March, 2020 – when the market plunged precipitously in the face of so much uncertainty – we have enjoyed a historic run in the market since 2009.

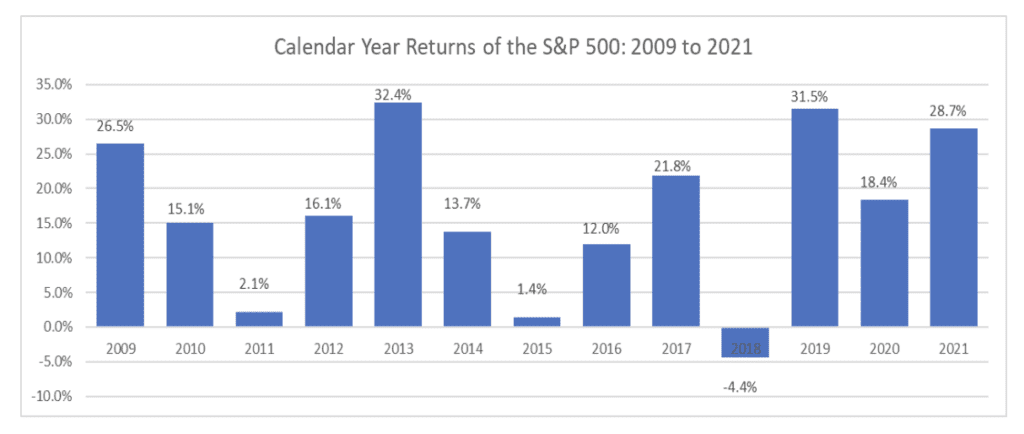
This chart shows the calendar year returns of the S&P 500 going back to 2009. Over the last thirteen years, we have had one year with a negative return. One. There were two years that were essentially flat, although still positive. The rest – ten of the thirteen years – saw double-digit returns. Five of the thirteen years saw returns over 20%. This is very, very unusual in U.S. market history.
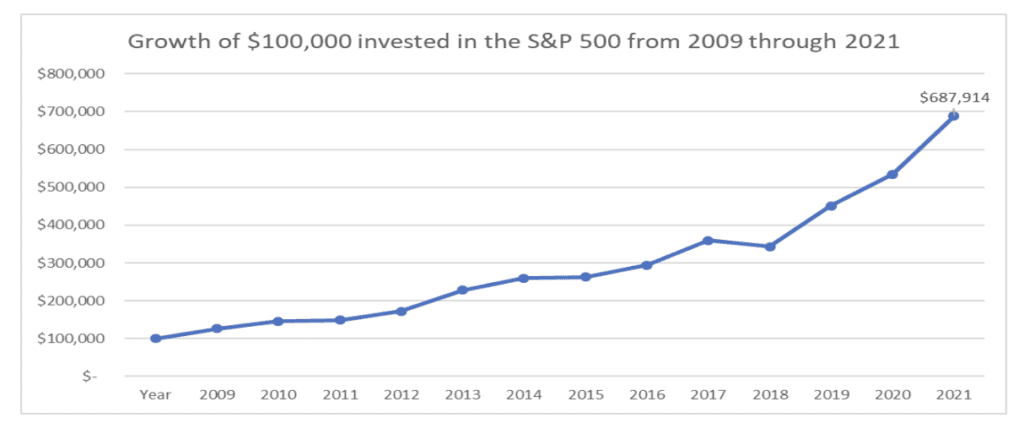
Another way to view the last thirteen years is to ask if an investor had invested $100,000 in the S&P 500 in the beginning of 2009, what would that investment be worth today? The chart below reveals the answer: $687,914.

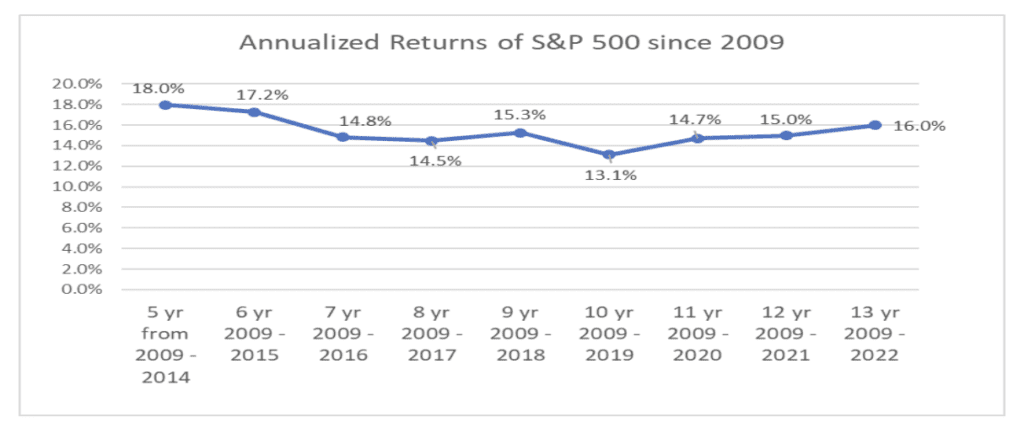
This is an average return of 16% per year. In fact, if you look at almost any annualized return period during these past 13 years, you would have to feel grateful for what transpired:

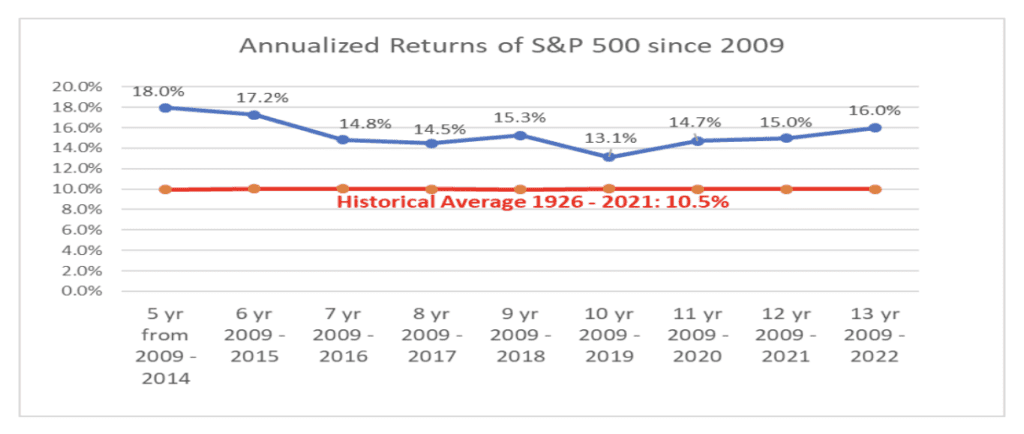
Starting from the left, this chart shows that for the five year-period from 2009 to 2014, the S&P returned 18% per year. After another year, over the six-year period from 2009 to 2015, the S&P 500 returned 17.2% per year. Looking to the last data point, an investor in the S&P 500 during the 13-year period from 2009 to the beginning of 2022 earned 16% per year. This is well above the long-term historical average. From 1926 through 2021, the average return on the S&P 500 has been about 10.5%.

A thirteen-year bull market, stretched U.S. equity valuations (stocks aren’t cheap), potentially rising interest rates, high recent inflation readings – you put this all together and you can understand why financial advisors are telling their clients to “Curb Their Enthusiasm” about future returns in the stock market. This can’t go on forever; therefore, as the late economist Herbert Stein said, it will stop.
Astute clients would be justified in asking: “haven’t you been saying this since around 2015”? Yes, we have, and we – along with most of the industry – have been wrong. The single-digit returns we were expecting during the second half of this decade materialized as double-digit returns, yet another example of the perils of even the most modest kind of forecasting.
We would not mind being wrong again if market returns continue to be strong, but we still think that now is the time to be especially prudent in one’s expectations about the generosity of future stock market returns. Although we don’t know precisely when or how this bull market will end, and once it does, we don’t know how long the bear market will last, or how quickly it will recover, we can infer from patterns in stock market history that long periods of strong stock market returns are often followed by more subdued returns.
History suggests that the stock market goes through alternating periods of robust growth and stagnation. From 1948 to 1966, during the post-WW II economic boom, the S&P 500 returned 14.3% per year (12.3% after inflation). But this was followed by a period, from 1966 to 1982, that saw the S&P 500 return 0% per year after inflation, sixteen years of moving sideways. Warren Buffett, in a 1999 article in Fortune Magazine, captured this period with his typically dry wit: “Now I’m known as a long-term investor and a patient guy, but that is not my idea of a big move.”
And then, over the next 17 years, from 1982 through 1999, the stock market made up for the prior 16 years of stagnation with an average return per year of 18.7%, one of the best periods in U.S. stock market history (14.9% after inflation). Following that period came another period of stagnation and side-ways movement, with the S&P 500 earning about -1% return per year from 2000 through 2009 (-3.4% after inflation).
Does this mean that this pattern will continue, and that the current 13-year bull market will absolutely be followed by another decade of sideways returns? No, it does not. Every period of history is unique. Each one of these 10 to 17-year periods had their own unique blend of circumstances, whether it was the pent-up demand and lack of global competition during the post-WW II period, or the inflation and stagflation of 1966 to 1982, or the period of declining interest rates during 1982 to 1999. The past is only a rough guide to the future.
Nevertheless, despite the limitations of looking to the past to make judgements about the future, we still think it is wise to temper expectations about future returns, given the reasons stated above: rich valuations, and the risk of rising interest rates and prolonged inflation.
We do not write this to suggest anyone should try to time the market or adjust their allocation. We write this only to say do not be disappointed if the returns in the markets going forward are not what they were during the last thirteen years. As always, think about your time frame, your goals, and your appetite for risk. And be grateful.

