Markets Update
In the world of investing, this year has been one to remember. There have been dramatic swings in the economic outlook that have driven substantial volatility in the value of both stocks and bonds. In the April edition of Partner Talk, the high level of market uncertainty was noted for the closing month of the first quarter. This high level of volatility, largely driven by the unknown impact of coronavirus, was evident in the day to day swings of the stock market and in the historically high reading of the VIX volatility index. Now that two more quarters are behind us, it is an appropriate time to revisit this issue and consider what might lie ahead.
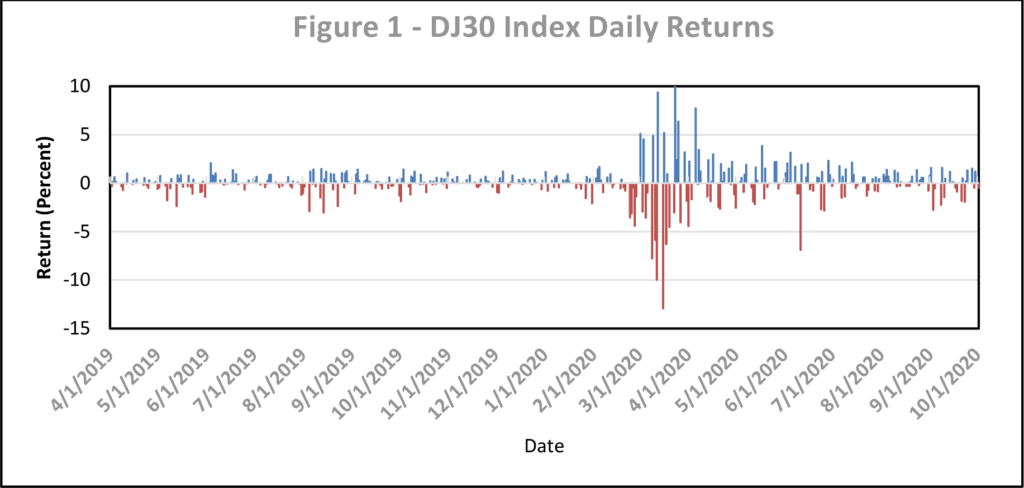
A comparison of the past two quarters of this year to the first quarter provides an interesting contrast. Large day to day fluctuations of the value of the stock market were common in the last three weeks of March. These large fluctuations did extend into early April but since that time the magnitudes of daily market moves have declined significantly. In the second quarter, from April 16 until June 30 the daily returns of the Dow Jones Industrial Average varied between -2.8 percent and 3.8 percent with only one exception. On the afternoon of June 10, a Federal Reserve release highlighted concerns about economic activity and the Dow fell almost 7% on June 11. In the third quarter, from July 1 through September 30, the Dow Jones Industrial Average daily returns varied between -2.8 percent and 2.1 percent. Figure 1 plots the daily returns in percent of the Dow Jones Industrial Average from April 1, 2019 through October 2, 2020. The decline in the volatility of the index returns from the middle of April through the end of the third quarter is apparent.
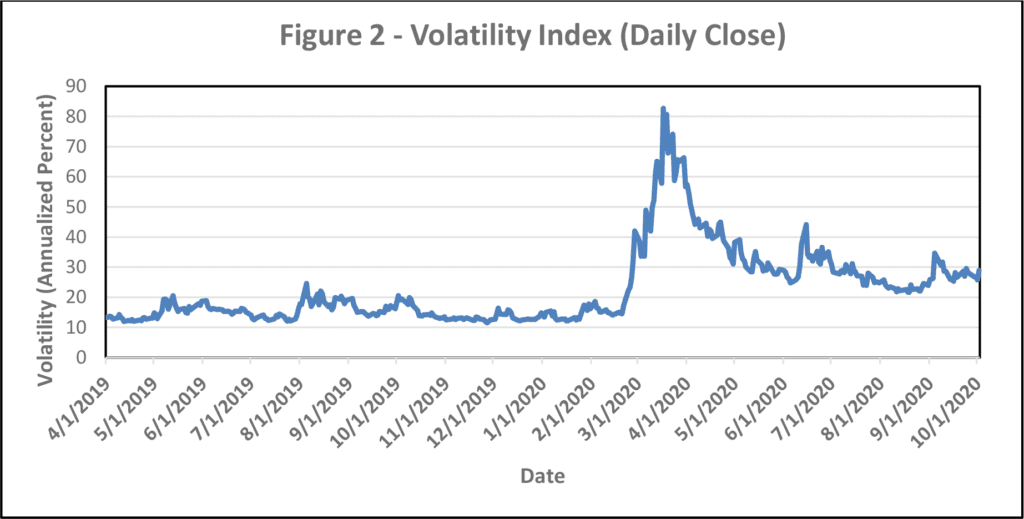
Further evidence of this volatility decline is presented in Figure 2 which plots the daily close of the VIX volatility index published by the Chicago Board Options Exchange (CBOE). This index is a forward-looking measure of stock market volatility expressed on an annualized percentage basis. Figure 2 is a graph of the index level over the same time period as used in Figure 1. From April of 2019 until the end of this past February, the VIX was very low with its average daily close at 15.2 percent. Then, the potential impact of coronavirus became evident and the index averaged 56.6 percent from the beginning of March until mid-April. From mid-April through June 30 the index averaged 32.9 percent and for the third quarter the average is 26.1 percent. It noteworthy that while the volatility has been significantly lower in the third quarter, it is still high on an historical basis.


Questions relating to how tightly stock market movements are linked to economic activity are often asked. A look at the U.S. economy as a whole is important to address these questions. The most recent release by the U.S. Bureau of Economic Analysis puts GDP real growth at an annual rate of -31.4 percent for the second quarter of this year.
However, this was not a surprise. As discussed in Partner Talk last April, this remarkably low number was expected. A rebound in economic growth in the third quarter now ending was also expected. That continues to be the case. While the government has not released its first estimate of GDP for this quarter, The Conference Board expects third quarter real GDP growth to be a solid 32.9 percent. In the fourth quarter GDP growth is expected to be positive but in single digits. If these estimates are realized, for the calendar year 2020, real growth of the U.S. economy will be negative at about -4 percent.
In contrast to GDP growth, the stock market value as measured by the S&P 500 index is up 5.57 percent through the end of the third quarter. This positive outcome is the result of solid second and third quarter returns which more than offset a disastrous first quarter when this index declined by almost 20 percent. The difference between economic growth and the return of the stock market highlights the forward-looking nature of the stock market. Prices not only reflect current economic conditions but also incorporate a consensus view of what the economy will do in the future. If the outlook for the future becomes positive, prices will on average appreciate even with weak current conditions.
While the stock market has been doing well over the past two quarters, the difficult question to answer is where does the market go from here? There are two major issues that warrant special consideration: the future path of coronavirus and the presidential election.
As far as the virus is concerned, with advances in the understanding of how it functions and with promising signs with respect to the development of therapeutics and vaccinations, there is hope that our environment can be normalized. Such an environment would be welcomed by all and presumably lead to both economic conditions and stock market behavior that are more familiar. However, since such an outcome is far from certain, from an investment perspective, risk control is as important as ever.
The other event that complicates the current investing environment is the upcoming presidential election. While election outcomes are generally difficult to forecast, both recent polls and the PredictIt market have given former Vice President Biden a lead. What will be the implications of a Biden victory for investors? That question is not easy to answer but changes to the tax code are very likely especially if the Democratic Party also wins control of the Senate. The proposed changes that would have significant implications for many investors is an increase in capital gains taxes and the elimination of the step-up basis at death.
Where does this current environment leave us? Monitoring the composition and risk of one’s investment portfolio becomes more important than ever. At PMA we do incorporate the many things happening in the marketplace into our analysis as we aim to control risk and to achieve high risk-adjusted performance.

